My previous blog entries have relied heavily on using Cisco lightweight APs in sniffer mode for packet analysis. This entry is no different. For a primer on using lightweight APs for packet capture,
click here.
I had the idea of using a lightweight AP in sniffer mode to measure the attenuation of a wall in my office. I understand that my method here is not typical, doesn't translate well to pre-installation techniques, and doesn't replace AP-on-a-stick. This blog is more of a "what's a cool thing I can do with a sniffer-mode AP and Wireshark."
Measuring attenuation though an obstacle is more involved than one may think, and I learned a few things studying the standard methods before capturing any packets. The signal source should be at least 4 meters from the obstruction, and the measuring device should be at least 1 meter from the other side of the obstruction. Using these distances, instead of something closer, means the dB loss will be more linear with distance, as apposed to inverse-square. See
Nigel Bowden's
excellent blog on this subject at Ekahau's website.
A lightweight AP that was already installed on the ceiling was used as a signal source. The AP was broadcasting two SSIDs on both 2.4 (channel 11) and 5 GHz (channel 36) bands with a beacon interval of 100ms. If you plan on trying this yourself, you should map at least 2 SSIDs to each radio; I'll explain later.
I used a sniffer mode AP on a long patch cable so I could move around. I started the packet capture, held the sniffer AP line-of-sight to signal source, then moved a few feet to my left to put the obstruction between the sniffer and the source.
Once I had the capture, I had to filter out any packets that were not from the AP I was measuring. The easiest way I found to do this was to look for beacon frames (wlan.fc.type_subtype == 0x8), and frames received with better than -65 dBm strength (wlan_radio.signal_dbm > -65). After reviewing to make sure my filter worked, I exported the packets (File ->Export Specified Packets), making sure to select "Displayed" for the export. This step will make generating the graphs later a bit easier.
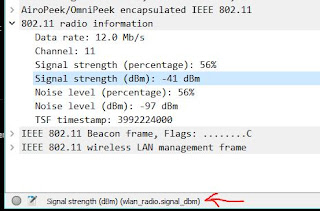
Open the capture file created by the export, and select Statistics -> I/O graph. Uncheck the box next to the "All Packets" default graph; we don't need to see it. Click the plus sign to add a new graph. I changed the name to "Channel 11". In the display filter field, enter a filter in Wireshark display filter syntax to limit what packets will be considered for the graph. I only want to see packets on channel 11, so I enter the filter wlan_radio.channel == 11. For the Y axis, change the drop-down from "Packets" to "AVG(Y Field)". In the Y-field box, enter a Wireshark display filter of the thing you want to graph. In our case, we want to see signal strength in dBm, so I put in wlan_radio.signal_dbm. (If you didn't know, when you highlight an item in the Packet Details window that Wireshark has a decoder for, it will show you relevant filter syntax in the status bar.)
Here is what the graph looks like. At left is line-of-sight, then behind the obstruction for about ten seconds. After that, I put the sniffer AP on a table and walked back to my workstation to stop the capture.
Note that the interval value is set for 1 second. This tells Wireshark to get the average value of signal strength for all packets on channel 11 over each 1 second period. With a beacon interval of 100ms, this should give you 10 samples for each SSID mapped to the radio. This is why you want more than one SSID; it gives you more samples to average over. If the Interval was set to 100ms, there would be points on the graph where there were no packets received during the interval. Wireshark considers this a value of zero, which I guess would be fine if we weren't working with negative numbers.
Repeat the process for channel 36. Click on the "Duplicate this graph" button, and change the display filter to wlan_radio.channel == 36. To make things easy to read, change the color of the line so it is distinguishable from the first one.
Eyeballing the graph, it looks like channel 11 encountered about 4 dBm of loss from the obstruction, but channel 36 had a whopping 10 - 12 dBm of loss.
I know it's not going to change the way Wi-Fi pros measure attenuation, but this was a fun way to visualize RF loss from obstructions but using some tools anyone with a Cisco lightweight infrastructure can replicate.


